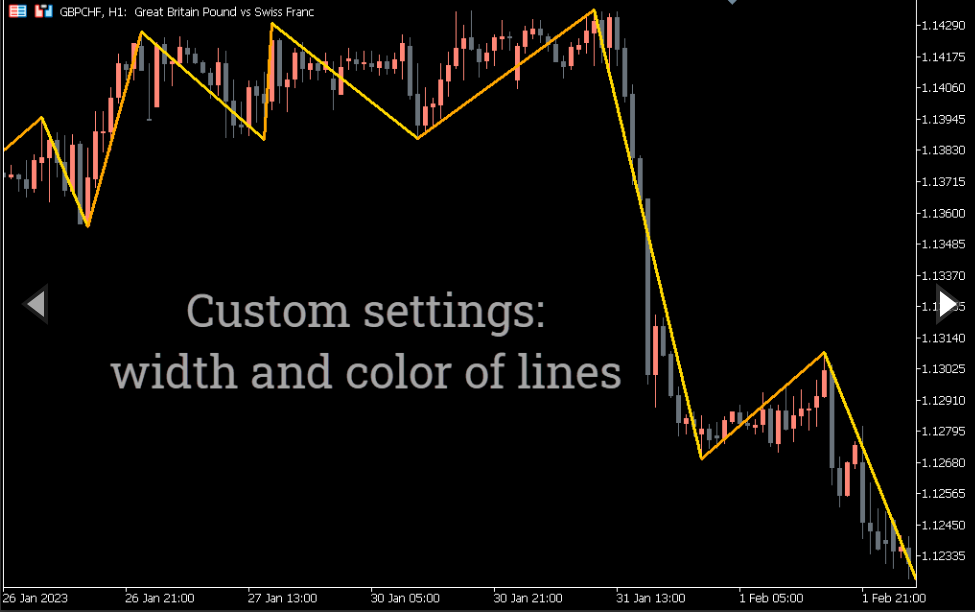
Forex BUY and SELL signals from the best ZigZag Fibonacci Fan indicator. Determine support and resistance levels based on Fibonacci ratios.
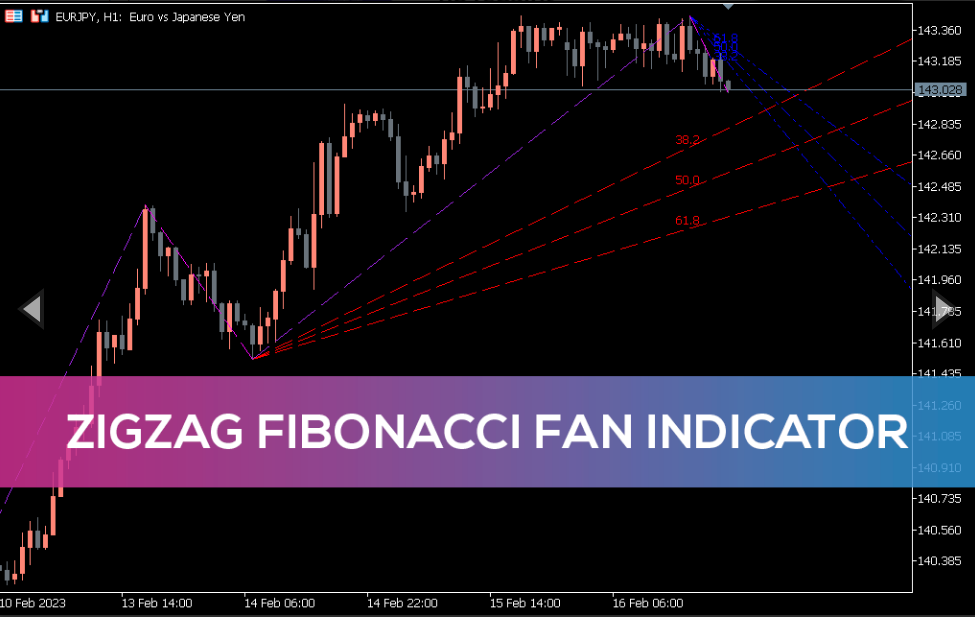
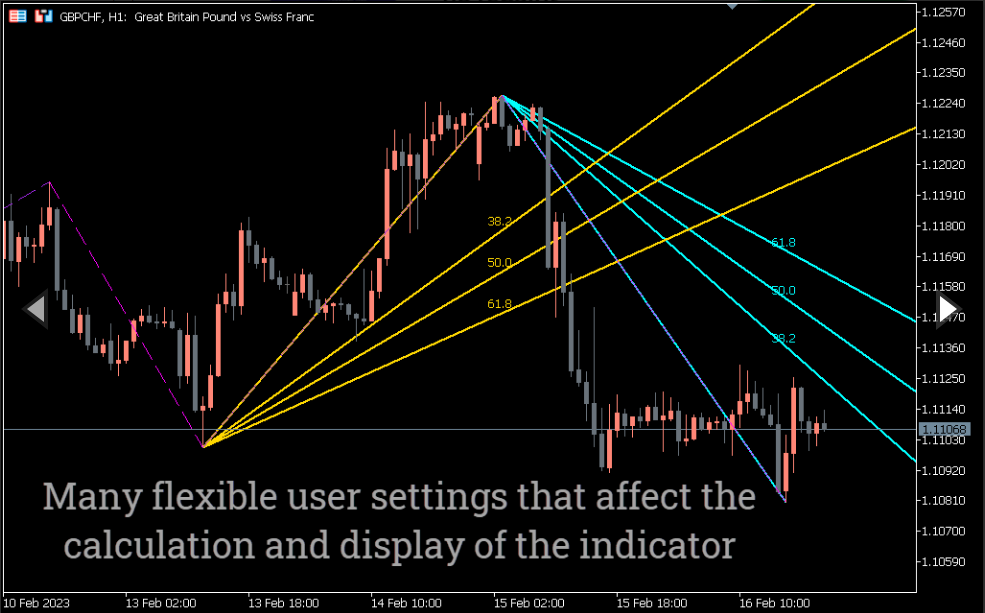
The ZigZag Fibonacci Fan Indicator is an MT5 indicator that uses Fibonacci ratios to plot support and resistance levels. The indicator uses Fibonacci ratios such as 23.6%, 38.2%, 50%, 61.8% and 80.9% for its calculations. The indicator converts these ratios into five lines.
The indicator draws lines from a high or low point and determines the direction of the trend. It automatically draws blue and red lines to identify a bullish or bearish trend so that traders can open positions accordingly.
While the indicator works best on any timeframe, traders should use longer timeframes to limit false signals.
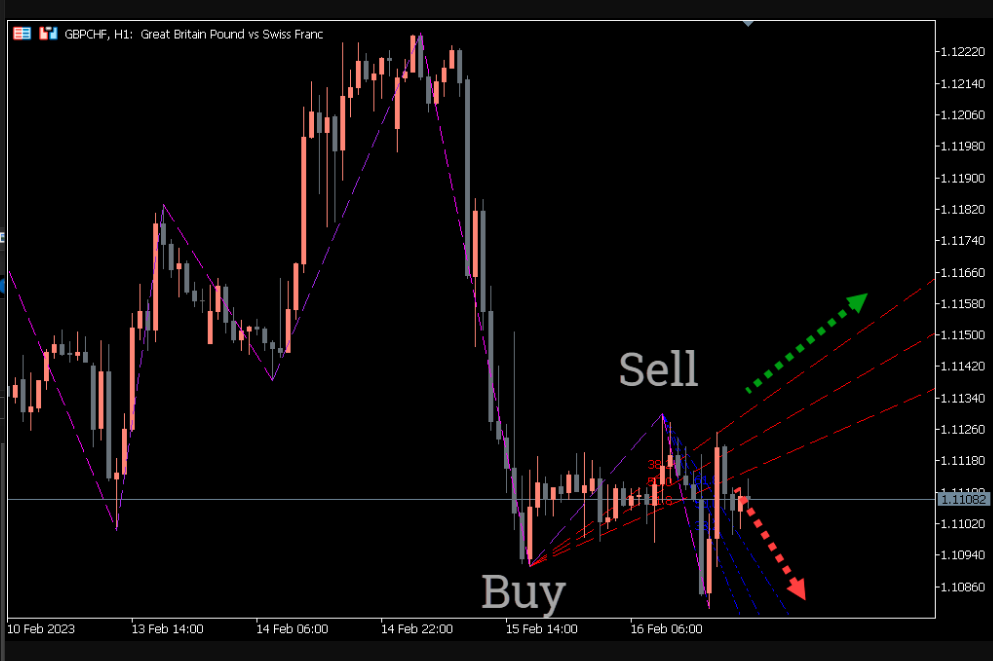
ZigZag Fibonacci Fan Indicator BUY/SELL signals
The GBP/CHF H1 chart above shows BUY and SELL signals with an indicator. To identify BUY and SELL signals, traders must find the lines. The indicator draws blue and red lines to indicate market trends. These lines act as support and resistance. Whenever the indicator draws red lines, it is a downtrend signal and traders need to go short or close long positions.
Conversely, when the indicator draws blue lines, this is an up signal and traders need to enter long positions or exit short positions. Traders can also apply the indicator with other indicators such as RSI or MACD to further confirm the signal.
Conclusion
The ZigZag Fibonacci Fan indicator uses Fibonacci ratios to plot five levels on a chart. Through these levels, traders can determine the direction of the trend. In addition, you can download the ZigZag Fibonacci Fan indicator for free from our website.
Reviews
There are no reviews yet.
Be the first to review “ZigZag Fibonacci Fan Indicator” Cancel reply
We use cookies to ensure that we give you the best experience on our website. If you continue to use this site we will assume that you are happy with it.Accept


Reviews
There are no reviews yet.