3d Oscillator Indicator
Forex market trend from the best 3d Oscillator indicator for MT5. Find the momentum of the trend.
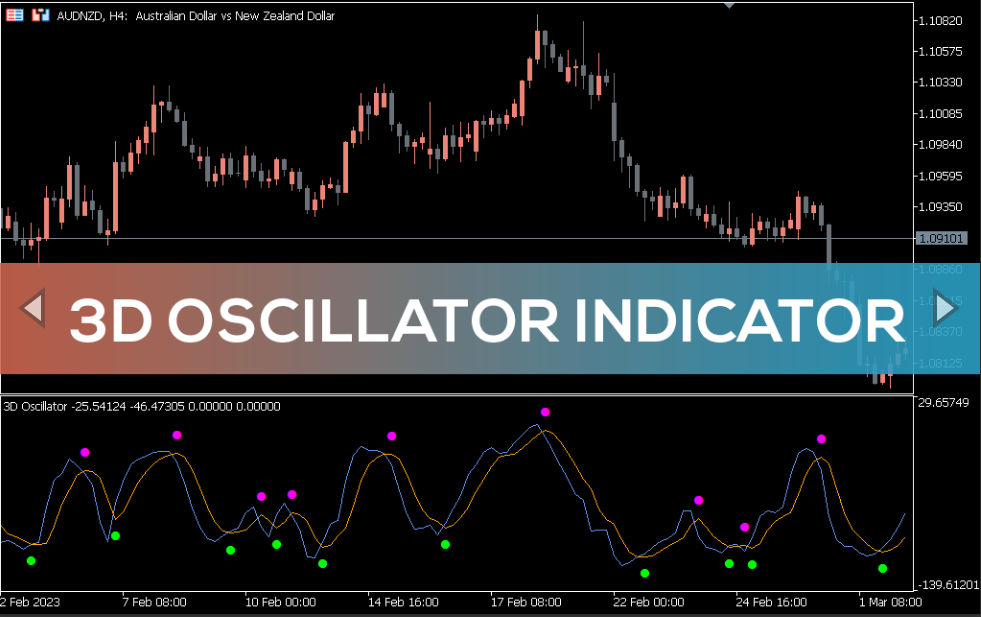
The 3d Oscillator indicator is an advanced version of the traditional stochastic oscillator. It consists of two lines: %K and %D. The %K line represents the current market position. In contrast, the %D line is a moving average of the %K line used to generate signals and identify potential entry or exit points.
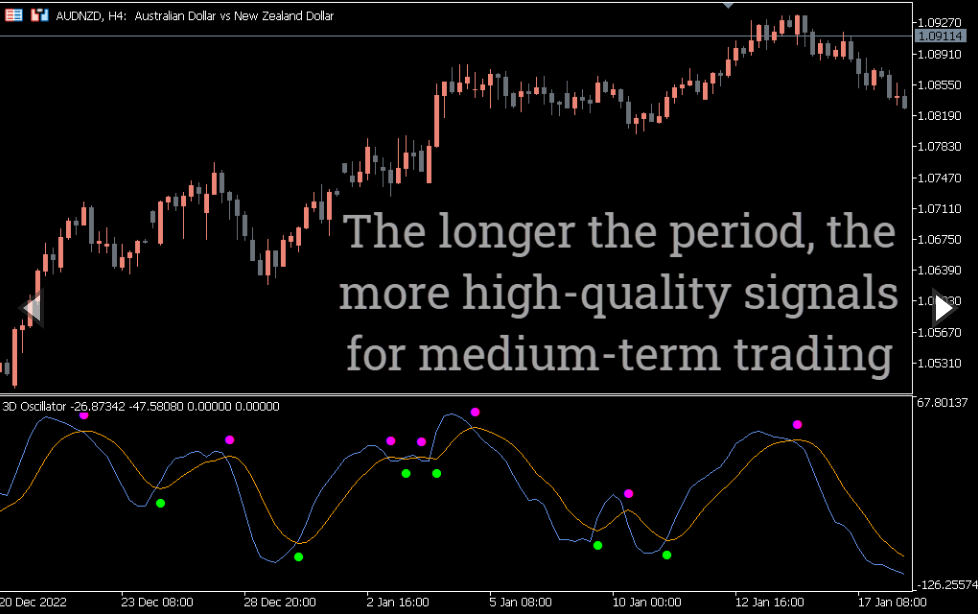
It’s good that the indicator works on all timeframes, just like the traditional Stochastic.
However, to avoid false signals, it is better to use the indicator on longer timeframes.
How To Use the 3d Oscillator Indicator for MT5?
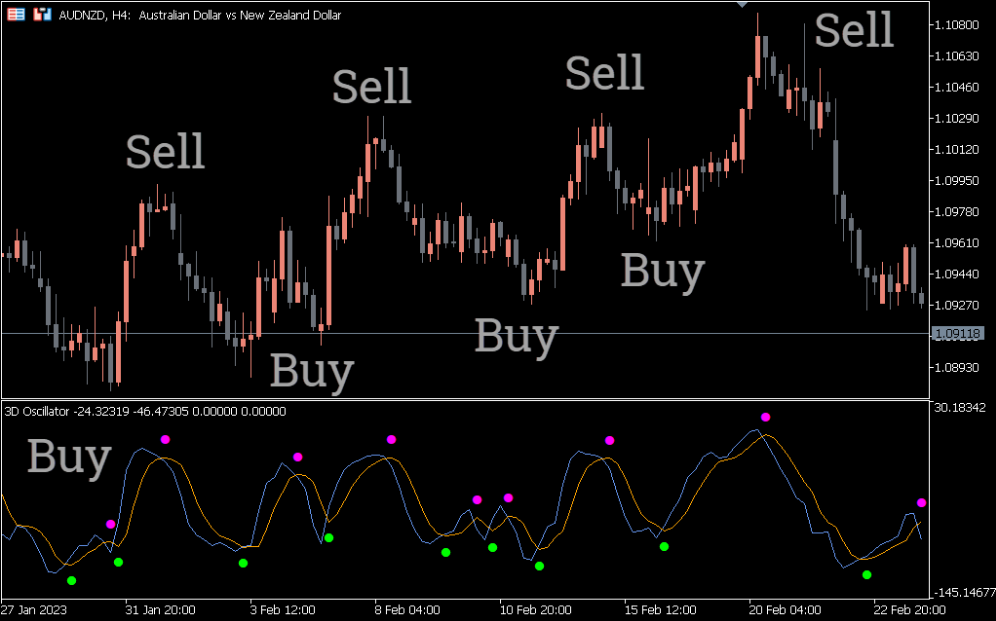
The AUDNZD H4 chart above shows the indicator’s BUY/SELL signals.
To know BUY/SELL signals, you must look for overbought and oversold levels.
When the oscillator rises above 80, this indicates that the asset may be overbought and you may enter a short trade. Conversely, when it falls below 20, it suggests that the asset may be oversold and you may go long.
You can also use the indicator to find discrepancies. For example, if the price is higher and the oscillator is lower, this suggests a bearish divergence and a potential trend reversal.
It is important to note that the effectiveness of these signals may vary depending on market conditions. So it is better to use other indicators along with the 3d Oscillator indicator to further confirm the signal.
Conclusion
The 3d Oscillator indicator for MT5 uses the traditional stochastic on the chart and determines the overbought and oversold levels. Once you find these levels, you can enter or exit a trade.


Reviews
There are no reviews yet.