SMI Ergodic Oscillator Indicator
The super tool to find reversals. It supports alerts and doesn’t repaint. Buy lows and sell highs with SMI Ergodic Oscillator!
SMI Ergodic is a technical oscillator, which is used to look for price reversals. SMI means “Stochastic Momentum Index”.
This universal oscillator is applicable to:
forex markets;
stock markets;
other financial markets.
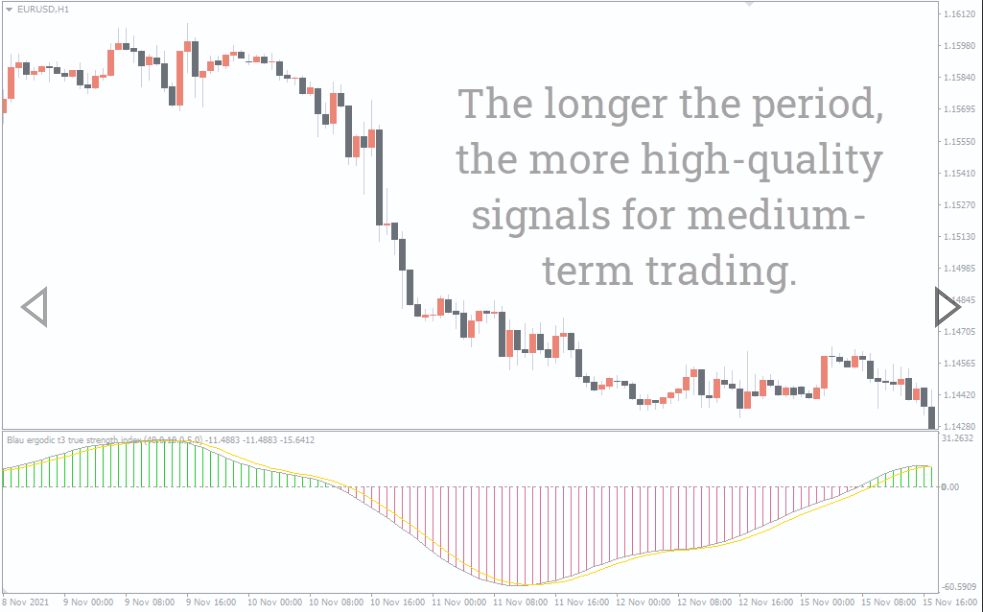
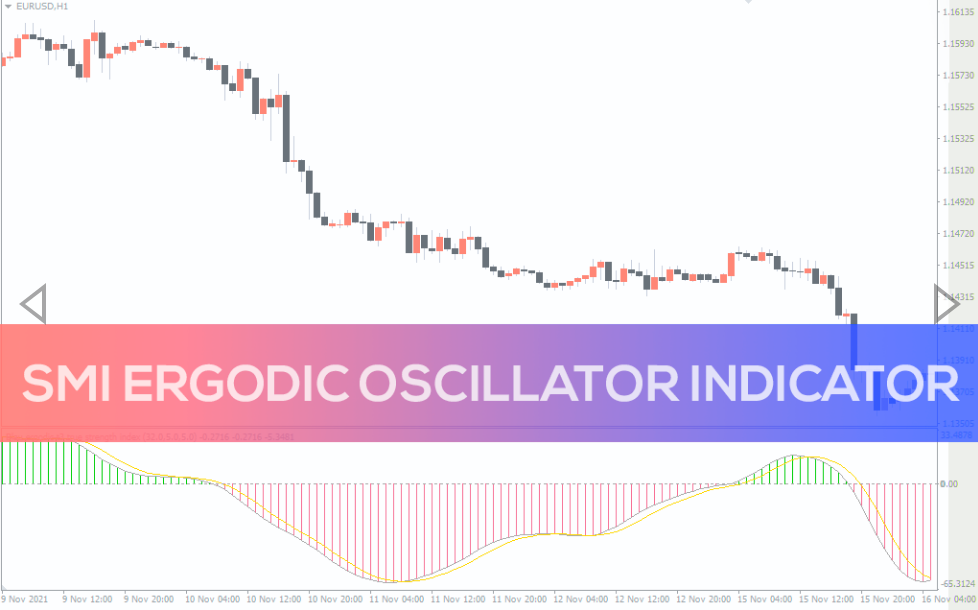
SMI Ergodic Oscillator is used in the Metatrader 4 platform. By adding it to the chart, you will see under the price area:
two-color histogram;
gray TSI line;
yellow signal line.
The gray TSI line uses the True Strength Index formula, and then converts the values obtained into a smoothed line, which oscillates around zero.
The yellow signal line is a smoothed TSI line.
A two-color histogram makes it easy to read the TSI line indications. If the TSI line:
rises above zero – the histogram displays thick green bars;
decreases above zero – the histogram shows thin green bars;
rises below zero – the histogram shows thin red bars;
decreases below zero – the histogram displays thick red bars.
How to use the SMI Ergodic Oscillator Indicator for trading
It is considered that SMI Ergodic Oscillator does not give clear signals. Thus, it is advisable to use the oscillator as an assistant tool:
in combination with other classical indicators, trend lines, signals of technical analysis figures;
to search for divergences;
in combination with signals from higher timeframes;
as part of more complex strategies.
The color of the histogram can be used as a trend indicator:
If the histogram is green → the trend is bullish.
If the histogram is red → the trend is bearish.
Looking at the SMI Ergodic Oscillator as the main tool, it can really help to buy at low prices and sell at high.
The examples below will give more clarity.
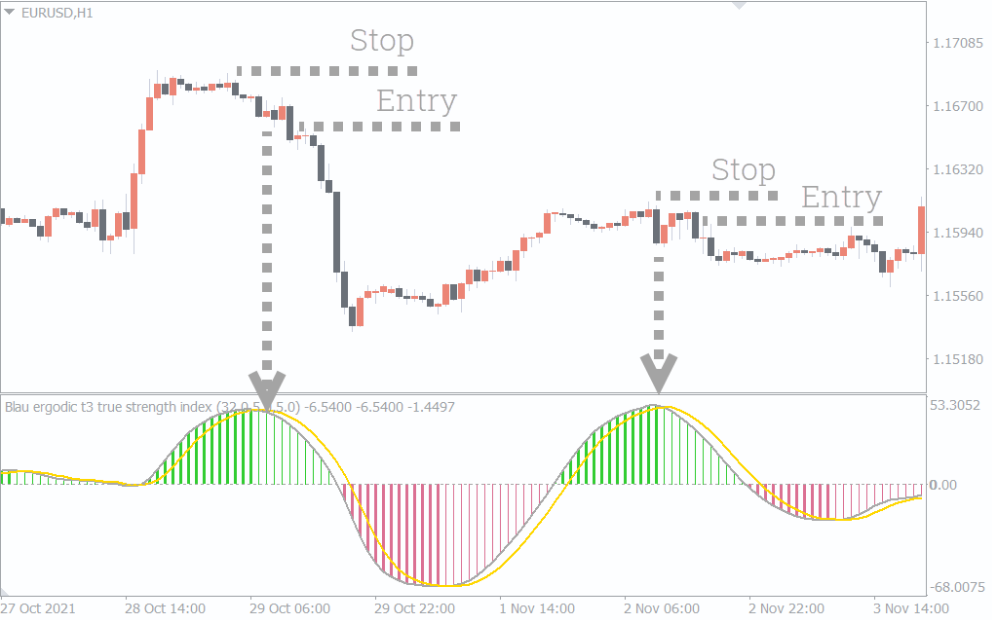
Sell Signals
The signal to sell comes when:
Both lines are in the positive zone;
TSI line crosses the signal line from top to bottom.
The chart above (EURUSD forex market, H1) shows 2 sell signals.
Each time, a protective stop-loss order is recommended to set above the previous local high, but you can use your own loss-cutting tactics.
The position can be closed in different ways:
at crossing the zero line (if you expect a short-term trend);
when there is a counter signal to buy;
using trailing tactics;
using a mathematical take-profit calculated on the size of the stop-loss.
Choose the method that best suits your personal preferences and circumstances.
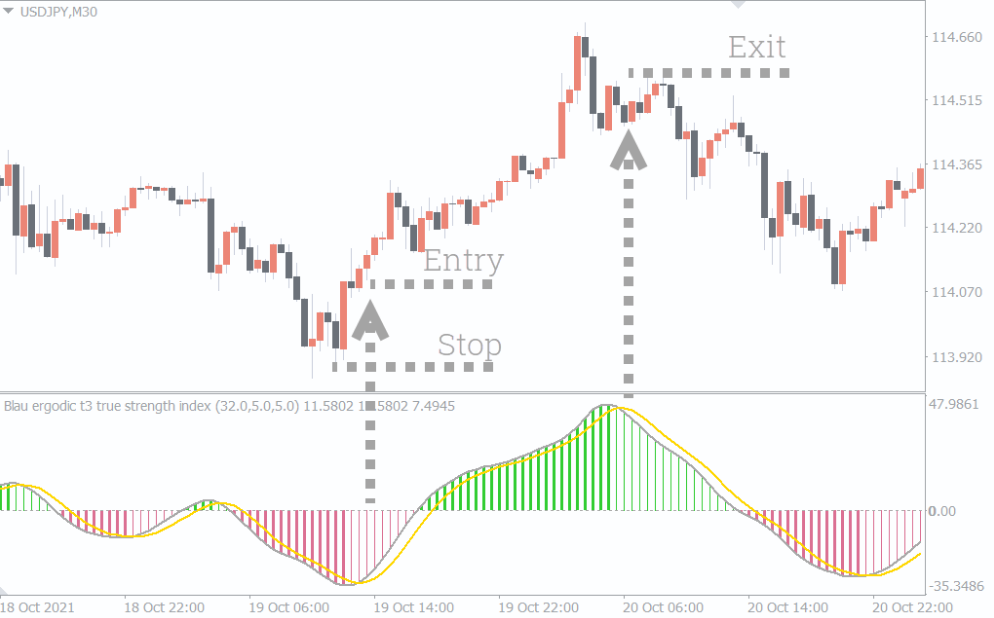
Buy Signal
The signal to buy comes when:
both lines are in the negative zone;
the TSI line crosses the signal line from bottom to top.
The example above (forex market USDJPY, M30) contains a moving average, which indicates the presence of a bullish trend. Therefore, preference should be given to buy signals, one of them we have marked on the price chart.
Set the stop-loss below the previous low. You can exit the position with a profit when receiving a counter signal, or using:
trailing stop-stop;
fixed take-profit.
Conclusion
The SMI Ergodic Oscillator for Metatrader helps you buy on the lows and sell on the highs and determine the direction of the trend.
Advantages of the indicator:
Non-repaint.
Sends alerts automatically as soon as signals.
Applicable for intraday trading as well as for opening investment positions on daily/weekly/monthly charts.
Allows you to analyze the history.
Applicable to any markets: forex, stocks and others.
Easy to understand.
Disadvantages of the indicator:
It can hardly be used as a completely independent tool.
It has a lagging character.
Be aware, the SMI Ergodic Oscillator for Metatrader does not guarantee accurate buy and sell signals. However, you can effectively increase the accuracy of the signals, for example, if you focus on:
sell signals near resistance zones;
buy signals near support zones.
Download SMI Ergodic Oscillator for MT4 indicator for Free Now!
You must be logged in to post a review.

Copyright 2025

Reviews
There are no reviews yet.