Histogram Divergence Indicator
Histogram Divergence Indicator For MT4 automatically plots divergences in price and MACD and provides forex trading signals.
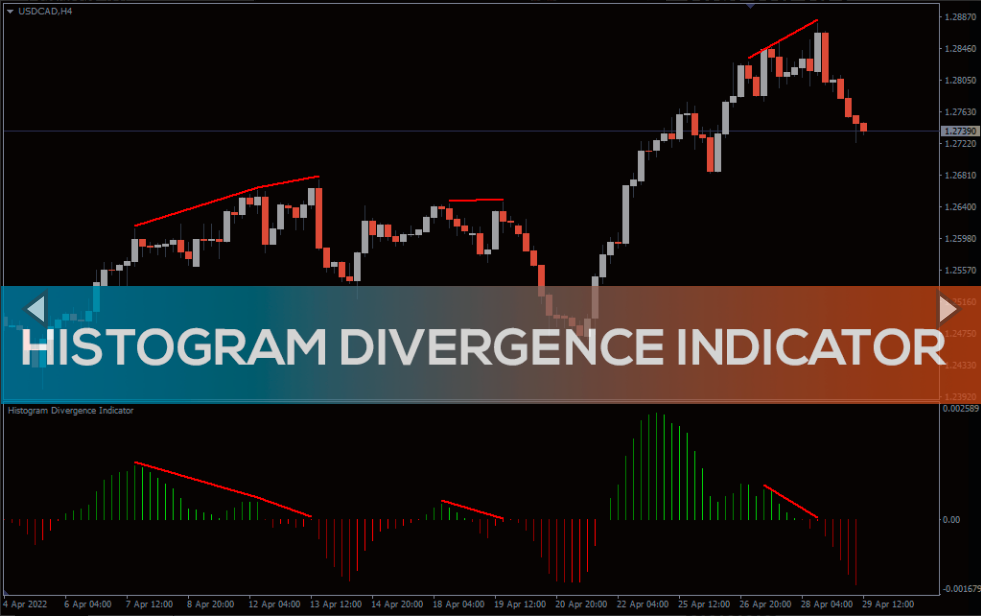
The Histogram divergence indicator for MT4 automatically identifies and plots divergence lines. The indicator applies the classic MACD – Moving Average Convergence and Divergence indicator to identify the divergence between the price and MACD. Furthermore, the indicator plots the bullish and bearish divergence lines on the price chart, and the indicator window. So, forex traders can easily identify the best entry points and Buy and Sell accordingly.
The indicator works on all intraday charts and also on long-term charts like the daily, weekly, and monthly price charts. Both new and advanced forex traders can use the indicator to trade divergence. Divergence trading is reversal trading and is prone to failure. So, advanced forex traders should apply technical analysis including price action to confirm the price reversals before entering the market.
Histogram Divergence Indicator For MT4 Trading Signals
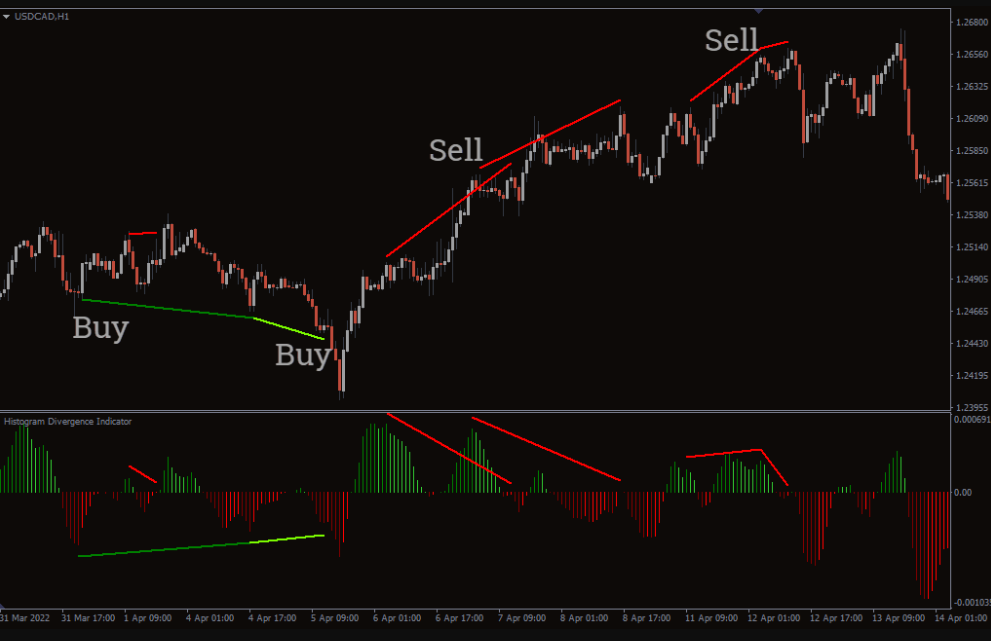
The above USDCAD H1 price chart shows the histogram divergence indicator for MT4 in action. The indicator plots the histogram as dark red, red, dark green, and green colors.
Divergence trading is all about identifying the potential trend reversal points. A valid divergence is identified if the price and the indicator values point in opposite directions. So, the indicator plots trend lines on the price chart and indicator once a divergence is identified.
If the indicator plots the line below the price, it indicates a potential bullish reversal. So, forex traders should enter a buy position with a stop loss below the previous swing low. The indicator does not provide a profit target so traders should book profits with a good risk-reward ratio.
Similarly, If the divergence is above the price, it indicates a potential bearish reversal. So, traders should place a Sell trade to enter the market with a stop loss above the previous swing high.
All kinds of price reversals are prone to failure and may provide multiple false entry signals. Because the indicator may detect the divergence early. However, there may be market participants left in the market in favor of the current trend. This could result in prices continuing to move further in the trend direction before the actual price reversal.
Divergences near strong support and resistance lines, channels, and trendlines provide the best results. Additionally, divergence trading using multiple technical indicators like the RSI – Relative Strength Index indicators provides the best results.
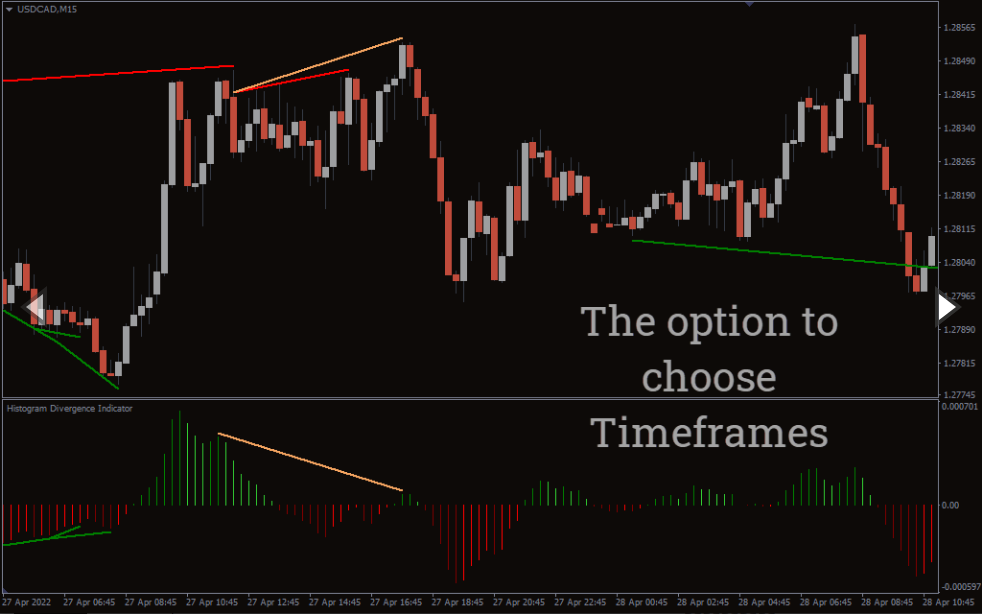
Furthermore, divergence found in higher time frame price charts tends to provide long-term price movements and are more profitable. However, the number of trading signals may be much lower. On the other hand, divergence trading signals in lower time frames occur frequently. So, this MetaTrader indicator is suitable for all kinds of traders like scalpers, intraday traders, and trend traders.
Conclusion
The histogram divergence indicator for MT4 is an essential trading tool for forex traders focusing on divergence trading. However, traders should confirm the price reversal after identifying the divergence. Additionally, forex traders can download the indicator for free and install it easily.
You must be logged in to post a review.

Copyright 2025

Reviews
There are no reviews yet.