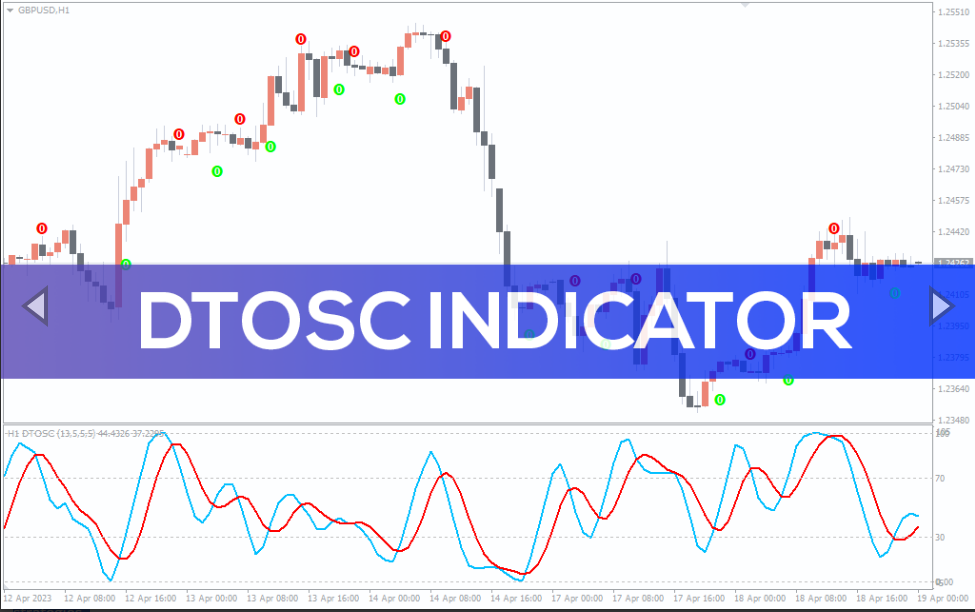
The DTOSC indicator for MT4 provides bullish and bearish forex trading signals using the stochastic of RSI
The DTOSC indicator is a stochastic of RSI and identifies the overbought and oversold trading conditions. Forex traders can use the DTOSC – Dynamic Trader OSCillator indicator to identify the extreme levels and then use the crossover of the signal lines for an entry. So, traders can apply simple crossover trading strategies to consistently produce forex trading buy and sell signals.
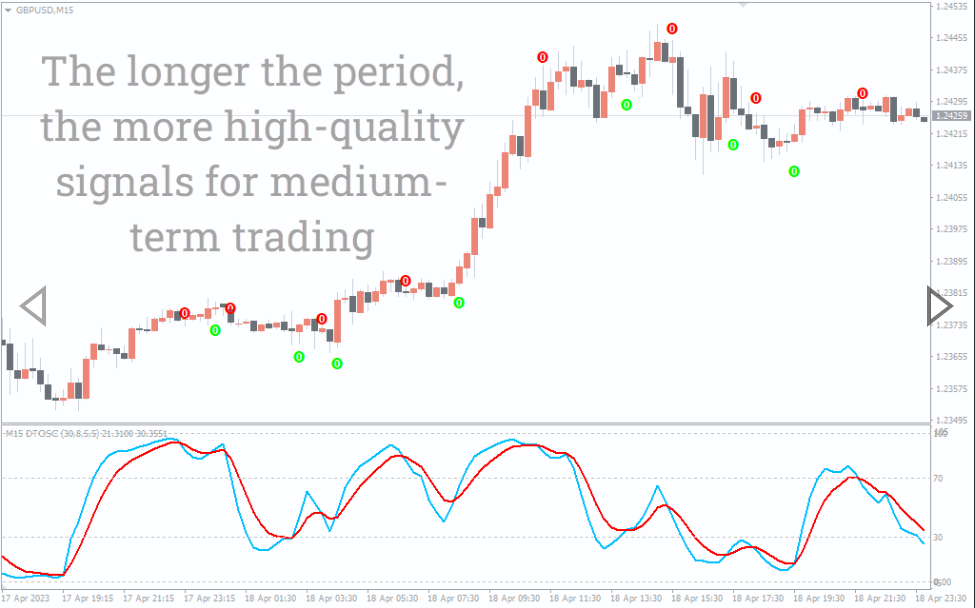
The indicator is very easy to use and is beneficial for both new and advanced forex traders. It works well in all chart time frames including the daily, weekly and monthly price charts. So, traders can use this indicator for multi time frame (mtf) forex trading strategies.
DTOSC Indicator For MT4 Trading Signals
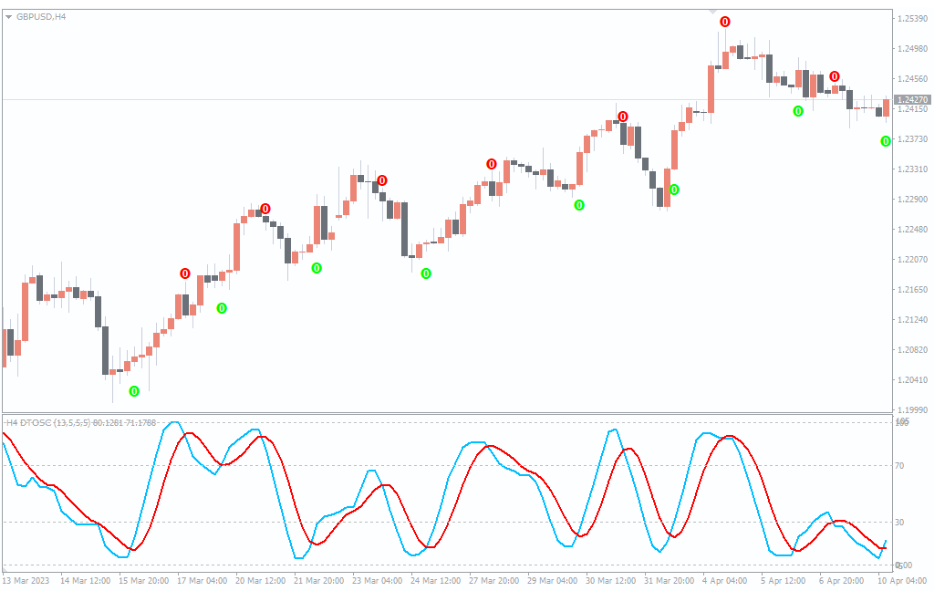
The above GBPUSD H4 candlestick price chart shows the DTOSC indicator in action. The indicator plots two signal lines on a separate indicator window. As a result, the crossover of the blue and the red lines indicate the beginning of a bullish or bearish trend cycle.
If the blue line crosses the red line upwards, forex traders should enter the market with a buy trade with a stop loss below the previous swing low. Similarly, if there is a downward crossover of the blue line and the red line traders should place a sell trade.
Additionally, the best strategy to book profits is at the opposite crossover or with a good risk reward ratio.
Conclusion
The DTOSC indicator for MT4 acts as trend following indicator while providing the best entry points using the overbought and oversold trading conditions. However, the indicator works well in higher time frame charts than the lower ones.
Reviews
There are no reviews yet.
Be the first to review “DTOSC Indicator” Cancel reply
We use cookies to ensure that we give you the best experience on our website. If you continue to use this site we will assume that you are happy with it.Accept

Reviews
There are no reviews yet.