ATR Bands Indicator
ATR bands indicator for mt4 – download free. Overbought/oversold mt4 indicator. Best support and resistance indicator
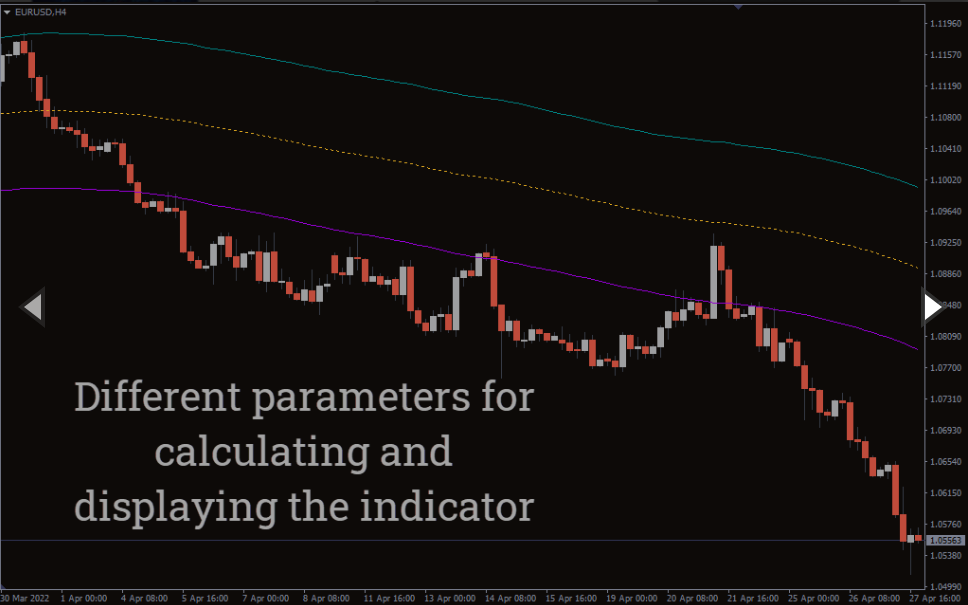
The ATR (Average True Range) Bands indicator for MetaTrader is a volatility-based indicator incorporated with an Average True Range (ATR) to ascertain the volatility in the market.
This technical indicator would come in handy as a good volatility detector, dynamic support/resistance tool, trend analyzer, and trend reversal tool. For instance, it contracts/expands to depict low/high volatility in the price of the asset.
Though the indicator looks somewhat like the famous Bollinger Bands, it slightly differs in function. The upper and lower bands of the indicator represent the higher and lower range of the price. Thus, the bands are calculated with the average true range of the price.
In essence, the ATR Bands indicator relies on the average true range of the price to define the volatility in the market. Besides, it also helps you to identify optimal zones for trade entries and exits. This is way better than the regular Bollinger Bands due to the vital role played by the ATR.
Furthermore, the indicator is easy to use, hence suitable for novice, intermediate and advanced forex traders. What’s more, it can be used for different trading styles like scalping, day/intraday, and swing trading.
How to Trade With The ATR Bands Indicator
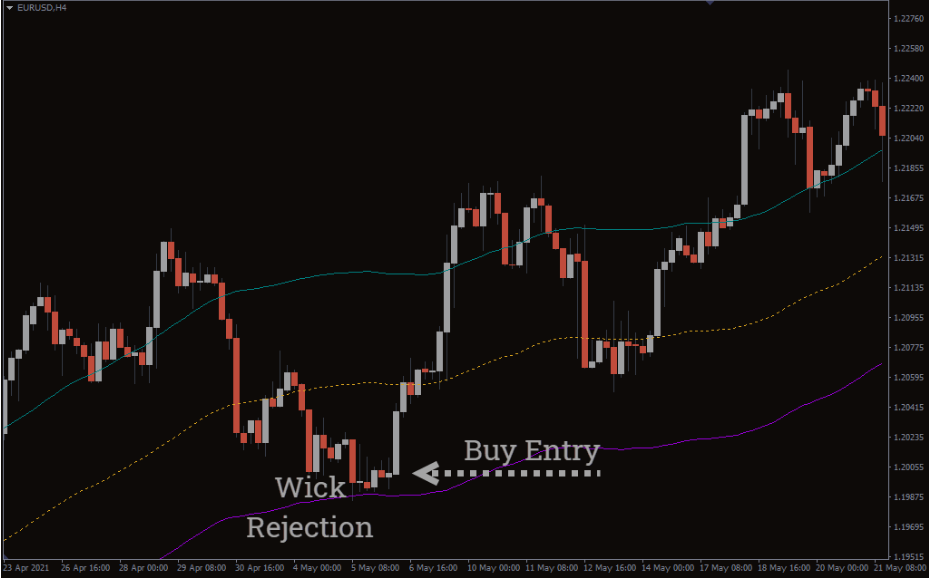
The above screenshot depicts how the indicator would look on your MT4 chart. It also illustrates how to identify a high probability setup.
The indicator is not recommended to be used in isolation but rather in sync with price action/other technical indicators for better efficiency.
BUY Signal: Firstly, wait for the price to swing to the lower band of the indicator, and then watch out for price rejection to the upside. With this condition, you may open a BUY/LONG position after price action also prints a bullish reversal candlestick pattern (e.g. bullish engulfing).
SELL Signal: Firstly, wait for the price to swing to the upper band of the indicator, and then watch out for price rejection to the downside. With this condition, you may open a SELL/SHORT position after price action also prints a bearish reversal candlestick pattern (e.g. bearish engulfing).
Conclusion
The ATR Bands indicator for MT4 doubles as a tool to measure the volatility of a trend and for optimal trade entries/exits. The indicator is one of the best trading arsenals suitable for identifying trend reversals, volatility, breakouts, and trend continuation. Finally, the indicator is free to download.
You must be logged in to post a review.

Copyright 2025
Reviews
There are no reviews yet.