Market Cycles Indicator
An excellent tool for accurate sell and buy signals. Market Cycles indicator helps identify perfect trade entry points.
The market hardly follows a smooth line. Instead, it moves in cycles characterized by peaks and troughs. Therefore, traders should enter into a trade during a swing high or low to get the maximum benefits. This is where the Market Cycles indicator comes in handy.
The Market Cycles indicator for mt4 – free download is an excellent trading tool for short-term swing trading. The indicator is vaunted for producing accurate trade signals. Additionally, it can be used to the scalp in ranging markets.
The Market Cycles indicator is suitable for use in lower time frames such as 5-minutes and 15 minutes. In addition, you can use the indicator to trade all types of currency pairs and financial instruments. These features make it a suitable tool for newbies.
How to Use the Indicator
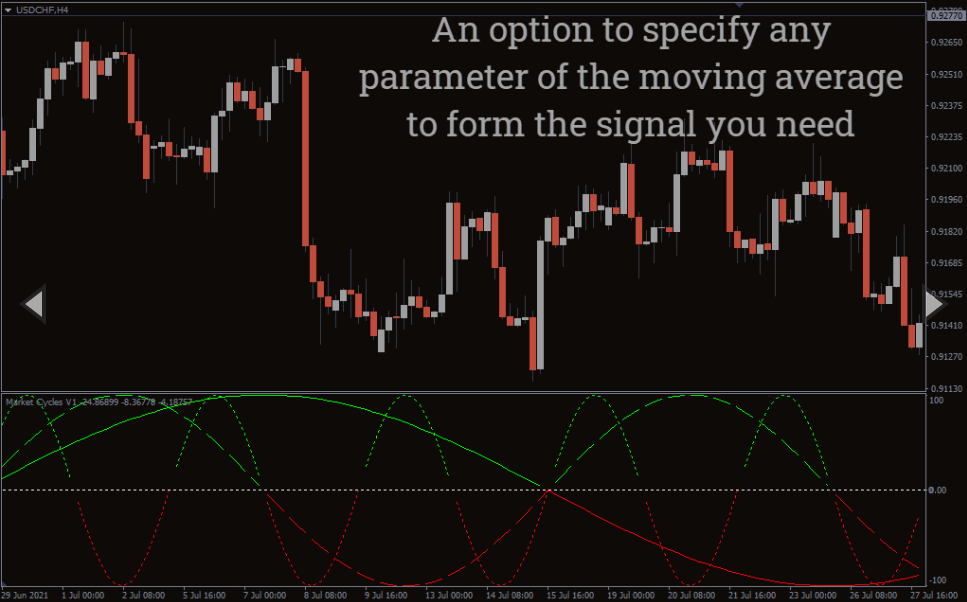
Essentially, the indicator comprises the moving average bands. The indicator provides buying and selling signals depending on the position of the MA lines.
Buy Signals
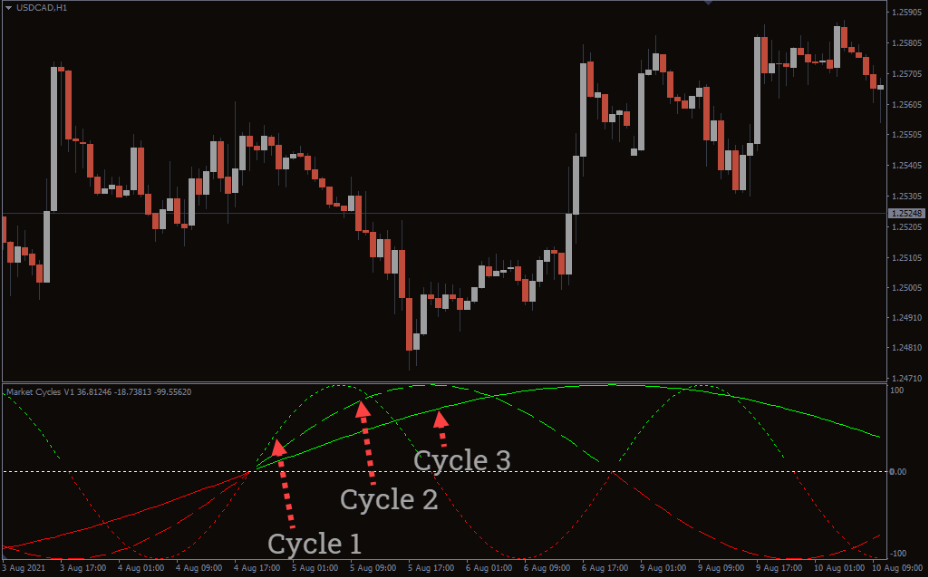
Now how do you use the indicator to identify good buying opportunities? Well, as mentioned, the Market Cycles indicator features moving average bands oscillating between positive and negative values. The three bands represent cycle 1, cycle 2 and cycle 3.
A buy signal occurs when cycle 1 moves above cycle 2 and cycle 3. Additionally, all the cycles should have positive values. How do you close your trade? Place a stop loss below the swing low.
An ideal take profit point should be placed when the cycle 1 band moves below the other cycles, and all cycles move below the 0 level.
Sell Signal
The sell signals occur when all the moving average lines move into the negative values. In addition, the cycle 1 band should be below the other two bands. Set the sell stop above the recent swing high. For exit strategy, take profit when cycle 1 goes above the other two cycles.
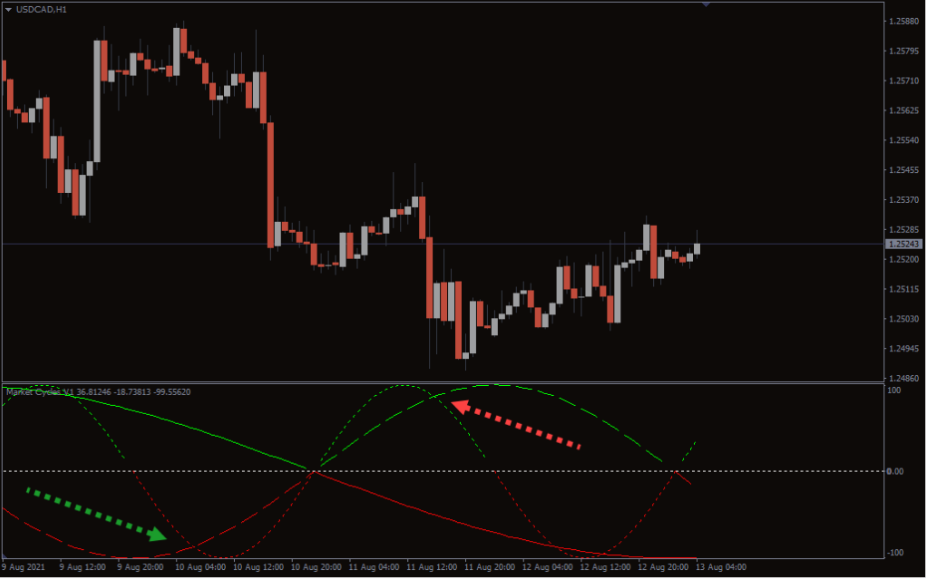
Trading Example
The above picture shows price movement for the US Dollar against the Canadian Dollar. The green arrow points to the exact place when the cycle 1 line moves below two lines. Also, all the bands move into the negative region (below the 0 level). This is a tell-tale sign of bearish pressure. In fact, the market experienced a downtrend after the signal.
Similarly, the indicator gives a buy signal when the cycle 1 line moves above the other two lines, as shown by the red arrow. It is worth noting that all the lines are moving in the positive region (above the 0-mark level). This is a strong buy signal. In fact, the market experiences a bullish movement after the signal.
Conclusion
The Market Cycles indicator is an excellent indicator for getting buy and sell signals. The indicator is based on the moving average, which enhances the accuracy of the signals. In addition, it is quite easy to use. Don’t take our word for it; download it today and watch your trade results improve.
You must be logged in to post a review.

Copyright 2025


Reviews
There are no reviews yet.