MTF MACD Indicator
Perfect tool for multi-timeframe trading. An excellent indicator for determining the general trend of an instrument and establishing perfect entry points.
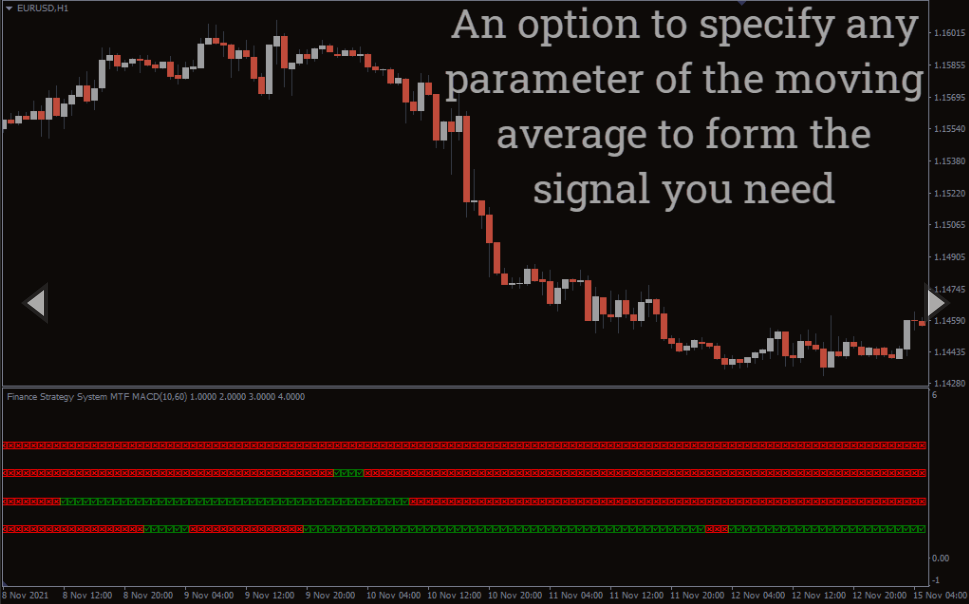
As a trader, you have probably come across a multi-frame trading strategy. This strategy involves checking various time frames such as 15 min 1h, 4 hours, and daily time frames to determine the direction of the trend and identify suitable entry points. However, this is a tedious job that involves juggling between various time frames. It is also time-consuming and confusing, meaning you can miss a good signal altogether. Multi time frame (MTF) Moving Average Convergence Divergence (MACD) indicator solves this problem.
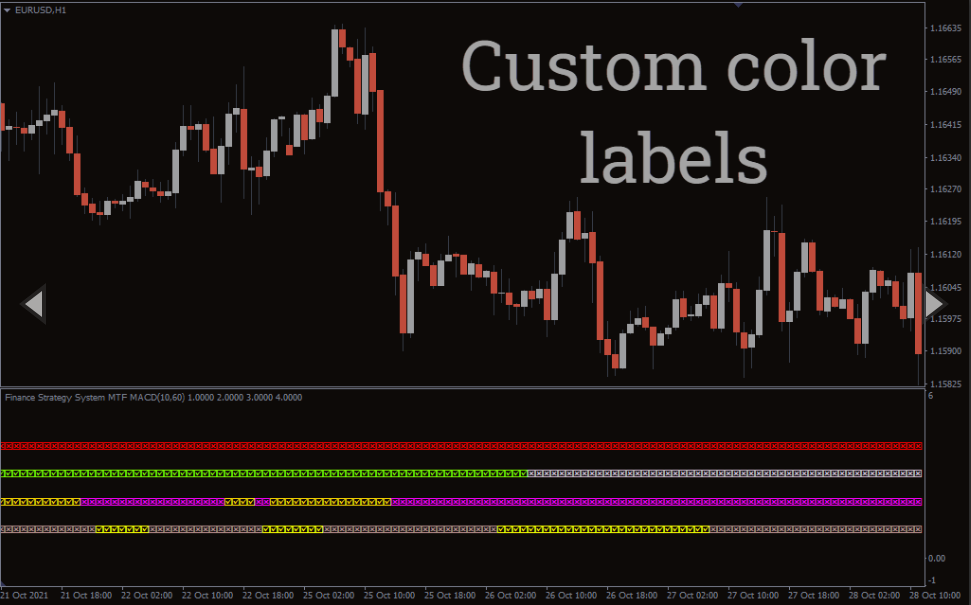
The indicator has four lines representing four different time frames. Therefore, regardless of the timeframe you are operating on, the indicator will show what is happening in the four specified time frames.
The first row closest to the chart represents the daily timeframe.
The second line represents the H4 time frame.
The third line represents that one-hour time frame,
The last line, furthest from the price chart, represents the 15 minute time frame.
How to use the MTF MACD indicator
Investors react differently depending on the dynamics of each time frame. For instance, if you are a scalper, you will focus more on the shorter time frames. However, institutional trades and long-term traders will focus more on the longer time frames.
The MTF MACD indicator can help to filter trades or enhance input signals. This means checking the higher time frame to get the overall trend and the lower time frame to choose an ideal entry point. Remember, the trend is your friend, and trading against the trend is quite suicidal, well, for your account.
To give you a clear picture, let’s assume you want to buy. First, you should wait for the daily time frame row to turn green. Then you should wait for the price to retrace. This means waiting for the other time frames to turn red. Once they turn green again, signaling the initial uptrend has resumed, you can open your long position.
Trading Example
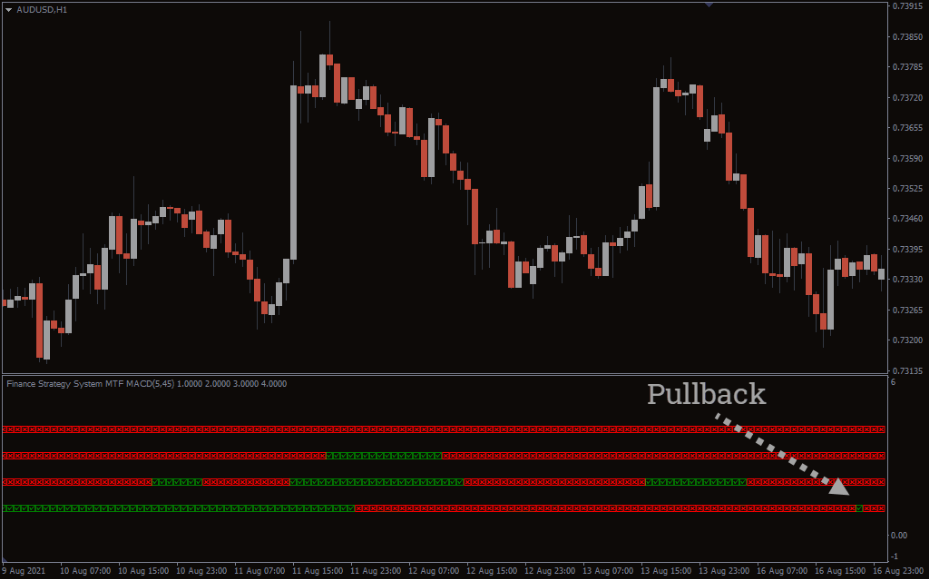
According to the indicator, the Daily, 4-hour, and 1 hour are bearish. Therefore, you should be looking to open a short position. However, timing is of paramount importance in Forex trading.
You do not want to enter a trade that is heading for a pullback. You could be right on the overall trend but suffer loss because of your entry point. The prudent thing to do is wait for a retracement.
In our example above, the market retraced on a 15 min time frame. Did you notice the MTF MACD indicator turned green? This signifies a pullback. You should enter the trade after the indicator turns green to red as the price resumes its initial downtrend.
Conclusion
Multi-time frame trading is a perfect way to maximize your trading result because it helps you choose an ideal entry point. But you do not have to keep checking the market behavior for several time frames. The MTF MACD indicator enables you to check four timeframes under one roof. The indicator is a must-have for people who want to boost their profits.
The MT MACD is not available on the usual MT4 Indicator database. Luckily, you can download it one our site for free. So now is your turn to download and make use of this handy indicator.
You must be logged in to post a review.

Copyright 2025


Reviews
There are no reviews yet.