Candle Overlay Indicator
Candle Overlay indicator for mt4 – download free. MT4 multi-timeframe indicator.
The Candle Overlay indicator for MetaTrader is a custom multi-timeframe indicator that draws the candlesticks of the higher time frames on the chart of a lower time frame. The indicator is a very handy tool for making a top-down analysis of any trading instrument.
In essence, you can view the price action of an H4 candlestick chart while on a lower time frame, say H1, for instance. This means you can see the opening, closing, wick, and body of an H4 candlestick while on an H1 chart. This in turn takes away the pain of always switching back and forth between different time frames during a trade analysis.
Besides, trading with the Candle Overlay indicator would help you to easily see some important market levels on the higher time frames. With such information, you can anticipate price reaction as it approaches such levels.
This MT4 indicator (Candle Overlay) is designed to work on timeframes lower than H4. It doesn’t recognize candlesticks’ actions of D1 and above. This is fair enough as most trading actions are taking on the H4 timeframes and below.
The Candle Overlay indicator is suitable for scalping, day, and swing trading. Furthermore, the indicator would be of benefit to both the new and experienced traders (professionals). The experienced traders would find it more valuable since they understand the importance of multi-timeframe analysis.
How to Use The Candle Overlay Indicator
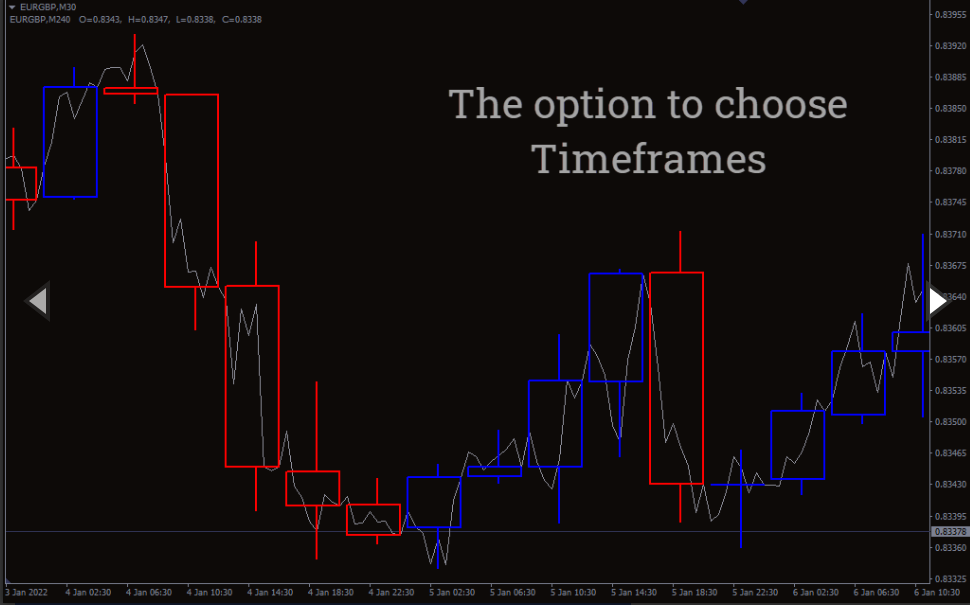
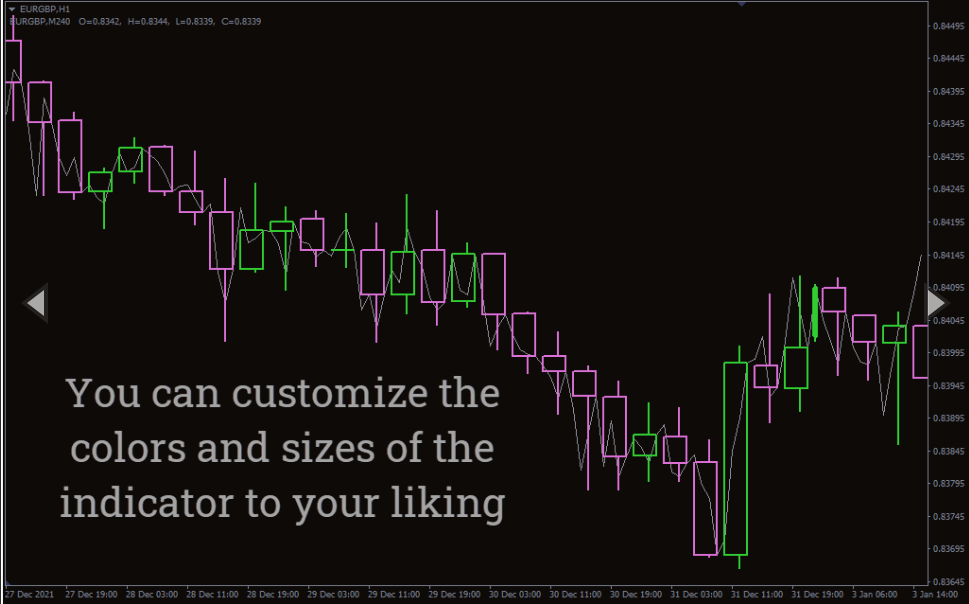
The above picture shows how the Candle Overlay indicator would look on your chart. It shows the behavior (opening of the price, wicks, etc.) of the H4 candlesticks on an H1 time frame. (Note that it takes four H1 candlesticks to form a candlestick of the H4 timeframe).
It is also important to state that the Candle Overlay indicator doesn’t generate trade signals. It is solely responsible for displaying the price action of candlesticks in different timeframes.
The price actions of a candlestick on higher time frames are painted in BLUE and RED colors on the chart. The BLUE candlesticks are the bullish candles while the RED candlesticks are the bearish ones.
A scalper, for instance, can be on a trade in a lower time frame and still monitor the price behavior of a candlestick on a higher time frame. This is because the price action on a higher time frame has a direct effect on the lower time frames.
Day and swing traders on the other hand can also use the indicator both for analysis and as well to see the turning points of the price on lower time frames for entries.
Conclusion
The Candle Overlay indicator for MT4 is a trading tool that would assist you with information on the market behavior on multiple time frames. With this indicator, multiple time frame analysis would be less of a hassle. Finally, it is free to download.
You must be logged in to post a review.

Copyright 2025


Reviews
There are no reviews yet.