Bollinger Bands Indicator
Bollinger bands indicator for MT4. Best forex Bullish and Bearish trend signals. BUY and SELL forex signals for range trading.
The Bollinger bands indicator for MT4 is a reliable indicator that can provide trend following trading signals and price reversal forex trading BUY and SELL signals. The indicator helps the traders to monitor and gauge price volatility. Furthermore, the indicator helps to follow the BULLISH and BEARISH price trends and ride them. Additionally, forex traders can anticipate increased price movements using the bands.
The indicator is well suited for new and advanced forex traders. New forex traders can use the indicator and understand the underlying price momentum, trend, and volatility at a glance. Advanced forex traders can use the indicator with other trend-following indicators and create complex technical trading strategies. Moreover, much automated software uses the trading signals of Bollinger bands as the indicator works based on a simple formula.
The indicator works on all intraday chart time frames and in daily, weekly, and monthly price charts. As a result forex traders use the indicator to trade multi-timeframe (mtf) forex trading strategies. Traders can identify the BULLISH or BEARISH price trend in higher time frames and find the best BUY and SELL entry points in lower time frames.
Bollinger Bands Indicator For MT4 Trading Signals
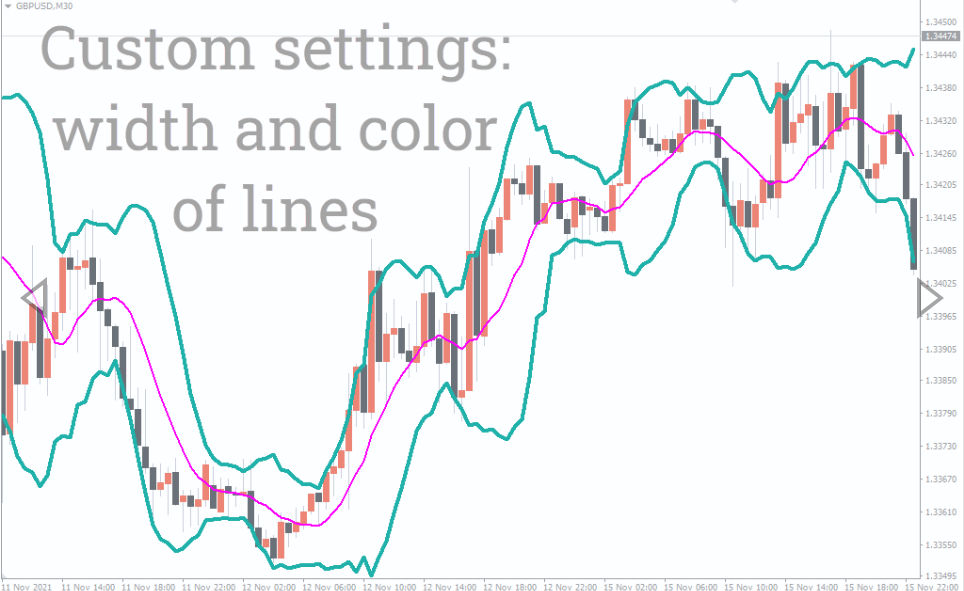
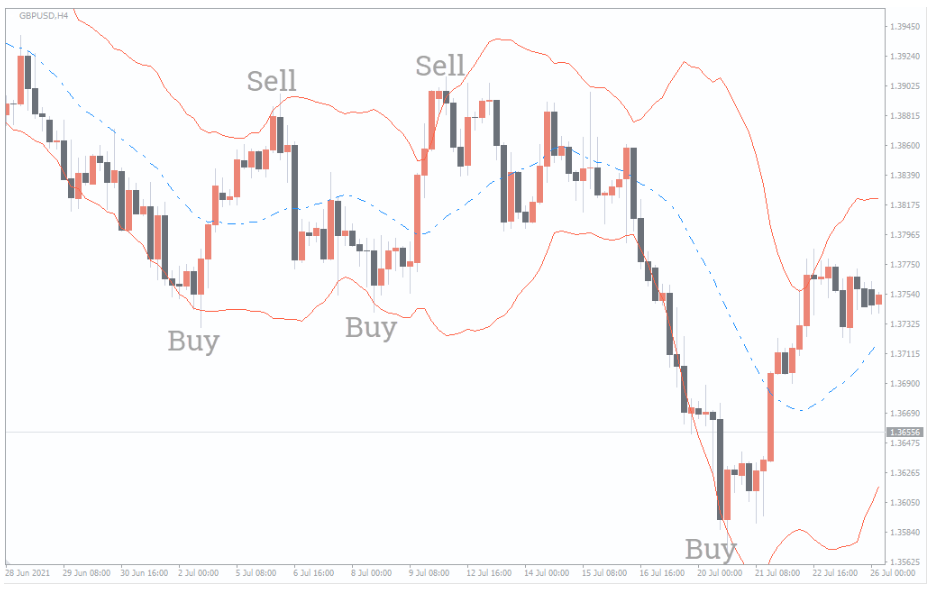
The above GBPUSD H4 price chart shows the Bollinger bands indicator for MT4 in action. The indicator plots the outer bands in Tomato and Midline in Dodger Blue. The midline is the moving average, while the outer bands are the standard deviation of the midline. Forex traders can apply the Bollinger Bands and trade in various methods.
If the price bounces from the upper bands it indicates a reversal, so traders can place a SELL trade and target the opposite bands, with a stop loss at the previous swing high Likewise, if the price bounces from the lower bands forex traders can place a BUY position.
If the price breaks through the bands and continues to do so with momentum, the trend is expected to continue. So if the price breaks the upper bands it indicates a BULLISH trend continuation, so traders should place a BUY position with a stop at the lower bands or the midline. Similarly, if the price breaks along the lower bands and continues along with the bands, then forex traders can SELL and ride the trend continuation.
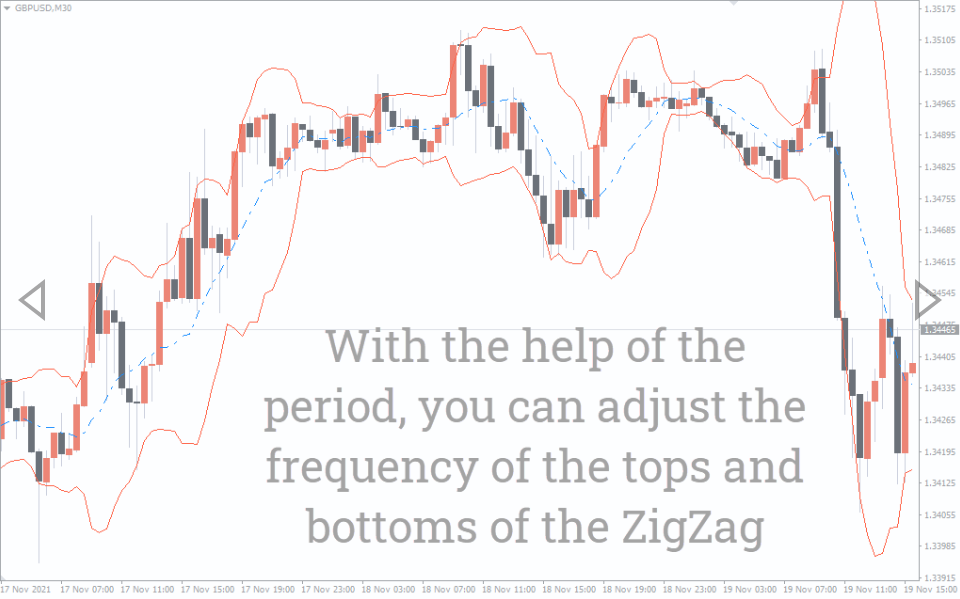
The distance between the Bollinger bands indicates the current market volatility. A wider band indicates a wider price movement and increased market volatility. On the other hand, a narrow band indicates very less market movement or volatility as the bands squeeze. This is generally followed by an abrupt market move which may be in a BEARISH or BULLISH direction.
Some technical forex traders use multiple bands around the midline to confirm trend reversals. Furthermore, adding oscillators with Bollinger bands improve the quality of technical analysis and trading signals.
Conclusion
Forex traders can trade the versatile Bollinger bands indicator for MT4 in multiple ways. Much forex auto trading software uses the Bollinger bands and incorporates them in complex technical trading strategies. Moreover, the indicator is free to download and easy to install.
You must be logged in to post a review.

Copyright 2025
Reviews
There are no reviews yet.